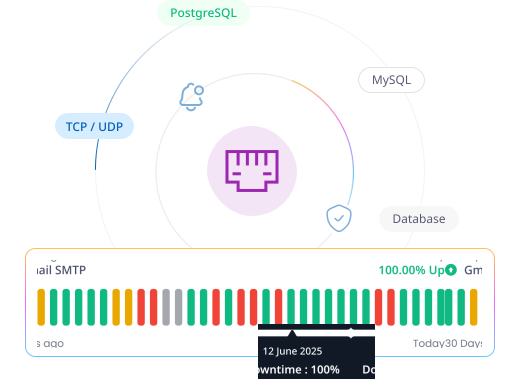
Advanced Features for Advanced Users
TCP & UDP
Monitor any TCP or UDP port to ensure services stay reachable worldwide.
Database Ports
MySQL, PostgreSQL, Redis coverage.
Custom Timeouts
Tune timeouts, retries, and sensitivity per service to match real behavior.
IPv4 & IPv6
Test connectivity over both stacks to catch version-specific outages.
Protocol Agnostic
Database, SMTP, FTP, SSH — test connectivity without touching internal app logic.
Game Servers
Track Steam, RDP, VoIP ports.
MONITOR INTERVAL
Control How Often Your Site is Checked
Start with our recommended frequency, or dial it in yourself. Faster checks spot trouble first; slower checks keep alerts minimal. Switch settings anytime—your monitors keep running.
Drag the Time Bar to Adjust Interval Time
Lightning-fast alerts for mission-critical services.
Add Monitors to Your Status Page — Instantly
Transform raw uptime data into a live, public-facing dashboard. Link any monitor directly to your branded status page and keep users informed without lifting a finger.

One-Click Linking
Attach any monitor to your status page in seconds — no coding or complex setup required.
Real-Time Updates
Incident changes are instantly reflected, so visitors always see the most up-to-date status.
Multi-Monitor Display
Show multiple monitors in one page, perfect for SaaS platforms or complex infrastructure.
Control Google Indexing
Organize monitors into categories like API, website, and backend to improve clarity for visitors.
Your Brand, Your Domain
Host status pages on your domain with full branding controls for a seamless customer experience everywhere.
Whitelabelled Solution
Replace platform logos and links with yours, delivering a fully branded, distraction-free status experience for teams.
Password-Protected Views
Limit access to sensitive status pages with secure password protection and role-based controls for trusted viewers.


SMS

Voice call

Slack

Zapier

Telegram

Webhooks

Discord

Microsoft Teams
Enterprise-Class Reliability

30-Second Checks
Critical systems fail fast—our 30-second checks detect outages within seconds, sending instant alerts before most users notice.

8+ Global Regions
Simulate real users in Tokyo, Berlin, and Dallas—multi-region probes uncover geo-specific failures your central monitor would otherwise miss.

Clear Response Tracking
Every check logs the response code your server actually returns, so a real outage and a network blip don't get mistaken for the same thing, helping you know at a glance whether it's worth escalating.
Set Up Port Checks in 60 Seconds
Choose Port Monitor
Select Port monitoring to check whether a specific TCP port on your server is open and accepting connections.
Enter Host & Port Number
Type your server's IP or domain along with the port number to check, then pick the check interval you prefer.
Activate & Get Instant Status
We run the first check instantly and alert you the moment that port stops responding.
Our Worldwide Monitoring Network

Tokyo, Japan

Germany

Bengaluru, India

Sweden

London, United Kingdom

Dallas, United States

Toronto, Canada
Multiple global regions, resilient infrastructure, and real support—everything you need to monitor at scale. Missing a location? Tell us.


Track & Manage Incidents easily with our native mobile app
Download Our App for Any Devices



Frequently Asked Questions
Why monitor TCP/UDP ports?
Ports are service entry points; if they’re closed, users can’t connect.
Can I monitor UDP services like DNS or VoIP?
Yes—UDP checks confirm response/availability for those protocols.
Can I monitor custom port numbers?
Yes, any port between 1-65535.
What's the difference between TCP and UDP monitoring?
TCP requires handshake confirmation; UDP verifies packet receipt.
Ready to Experience Zunoy?
Start your journey with Zunoy’s powerful suite of tools, designed for startups, developers, and growing teams alike.

Uptime
Monitor websites & APIs with instant alerts and shareable status pages.
Operational
Available On


Contact Us On
Mail Us
support@zunoy.comCopyright © 2026 - Mentcube Innovations Pvt Ltd.. All Rights Reserved.